

* For further context regarding the firm’s position for England and Wales, please see SRA Diversity Data Publication 2025
Our Firm progress snapshot
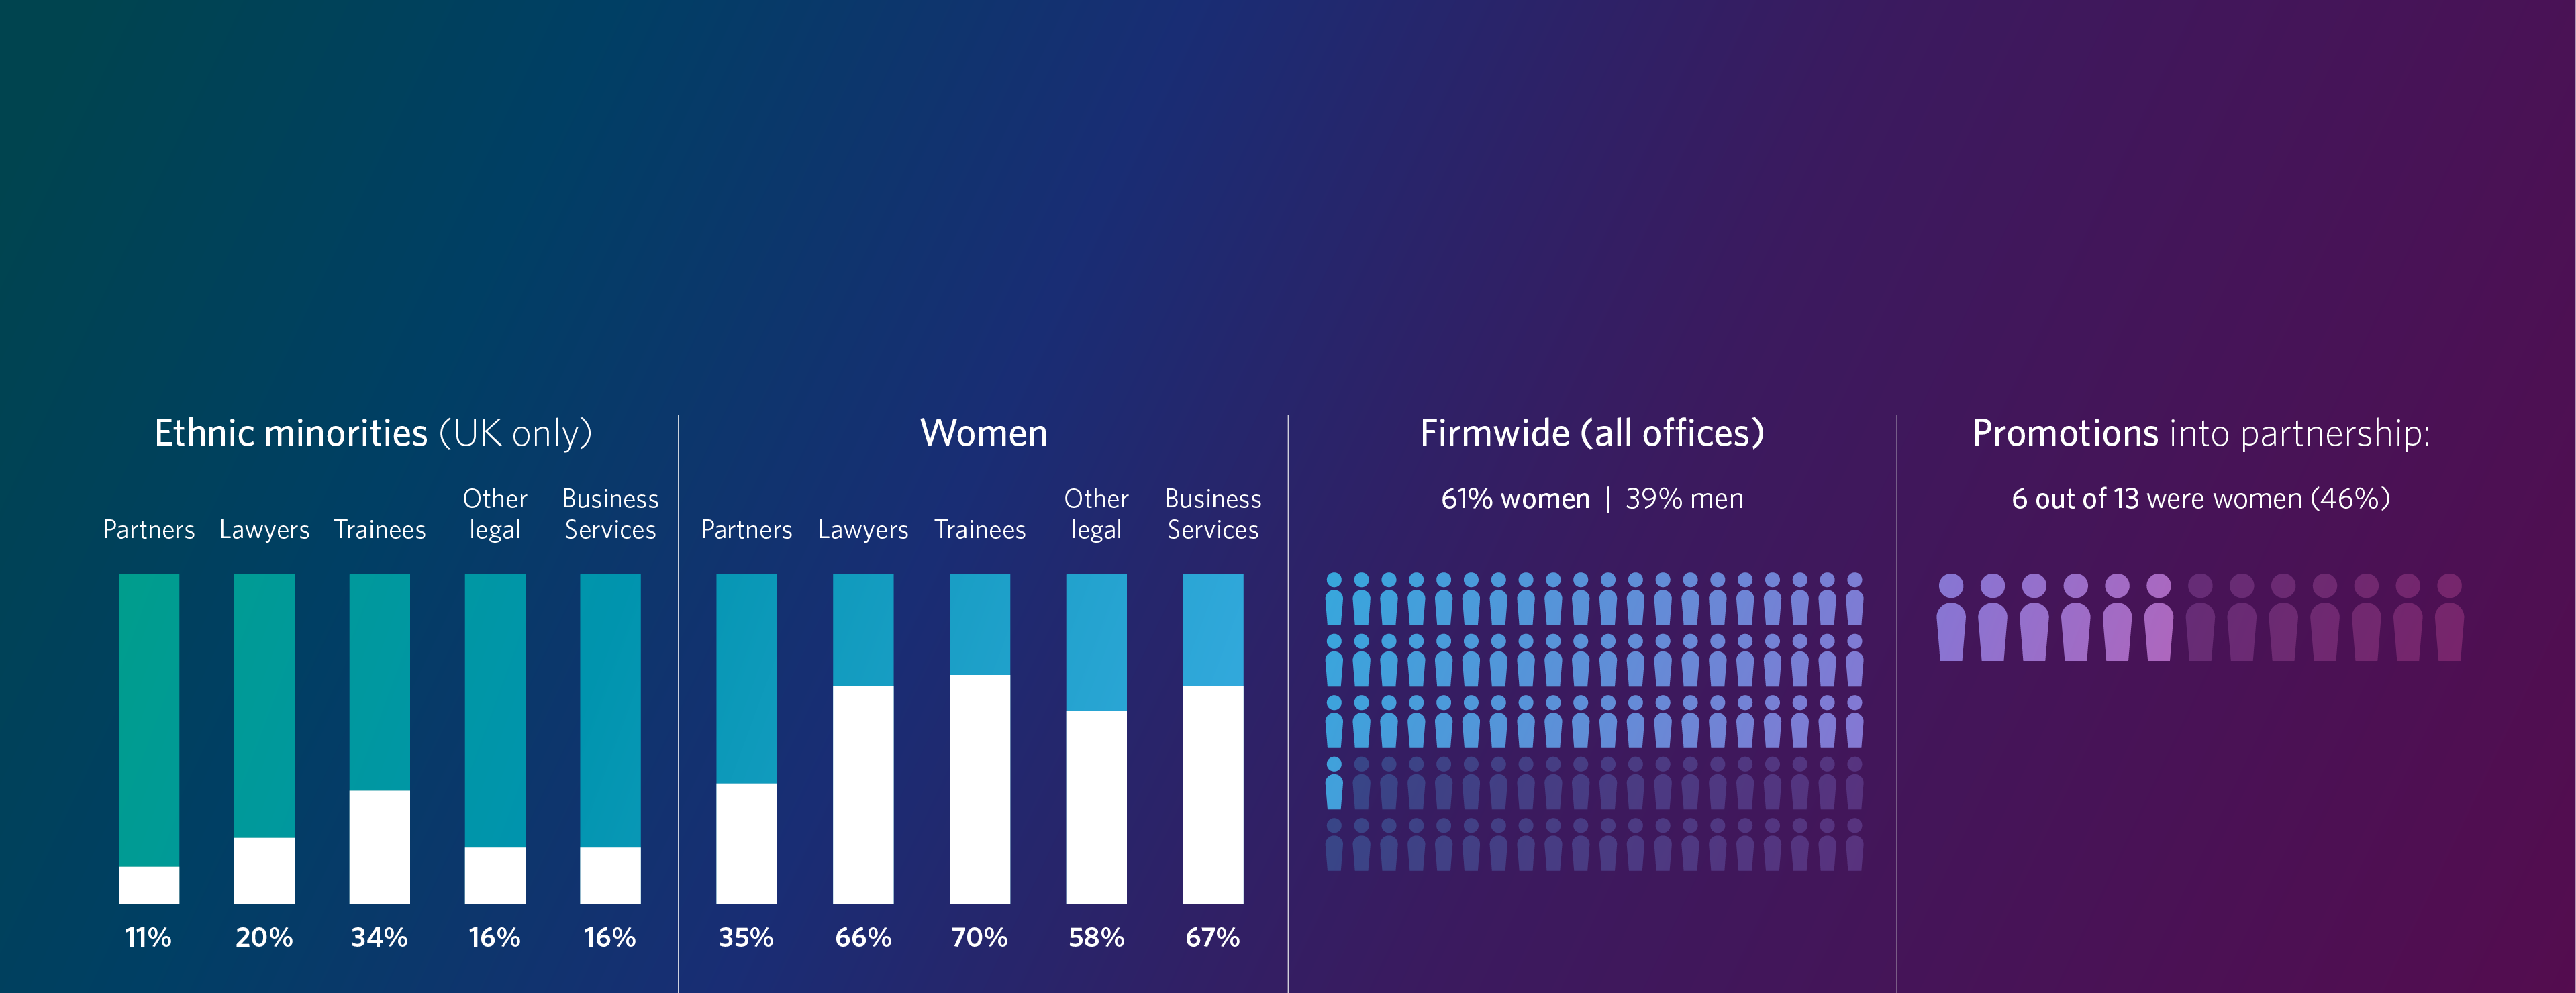
An inclusive firm with a diverse workforce
Current diversity statistics as of April 2025*

12
Sustainability in action 2025


* For further context regarding the firm’s position for England and Wales, please see
Our Firm progress snapshot
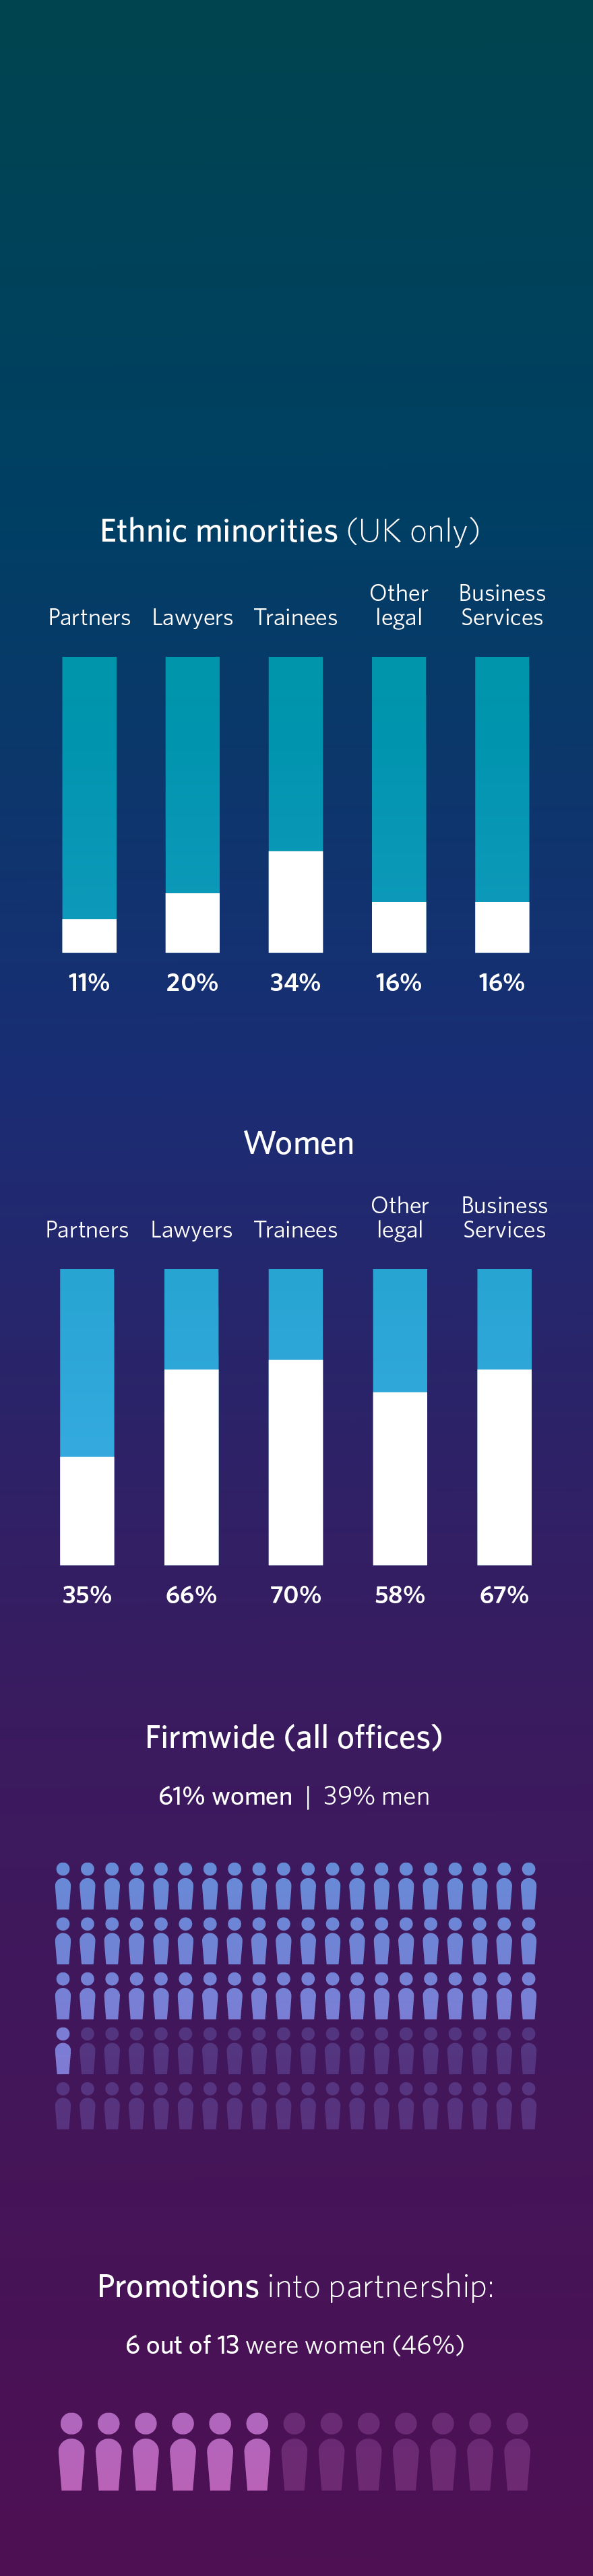
An inclusive firm with a diverse workforce
Current diversity statistics as of April 2025*

12

* For further context regarding the firm’s position for England and Wales, please see SRA Diversity Data Publication 2025
Our Firm progress snapshot
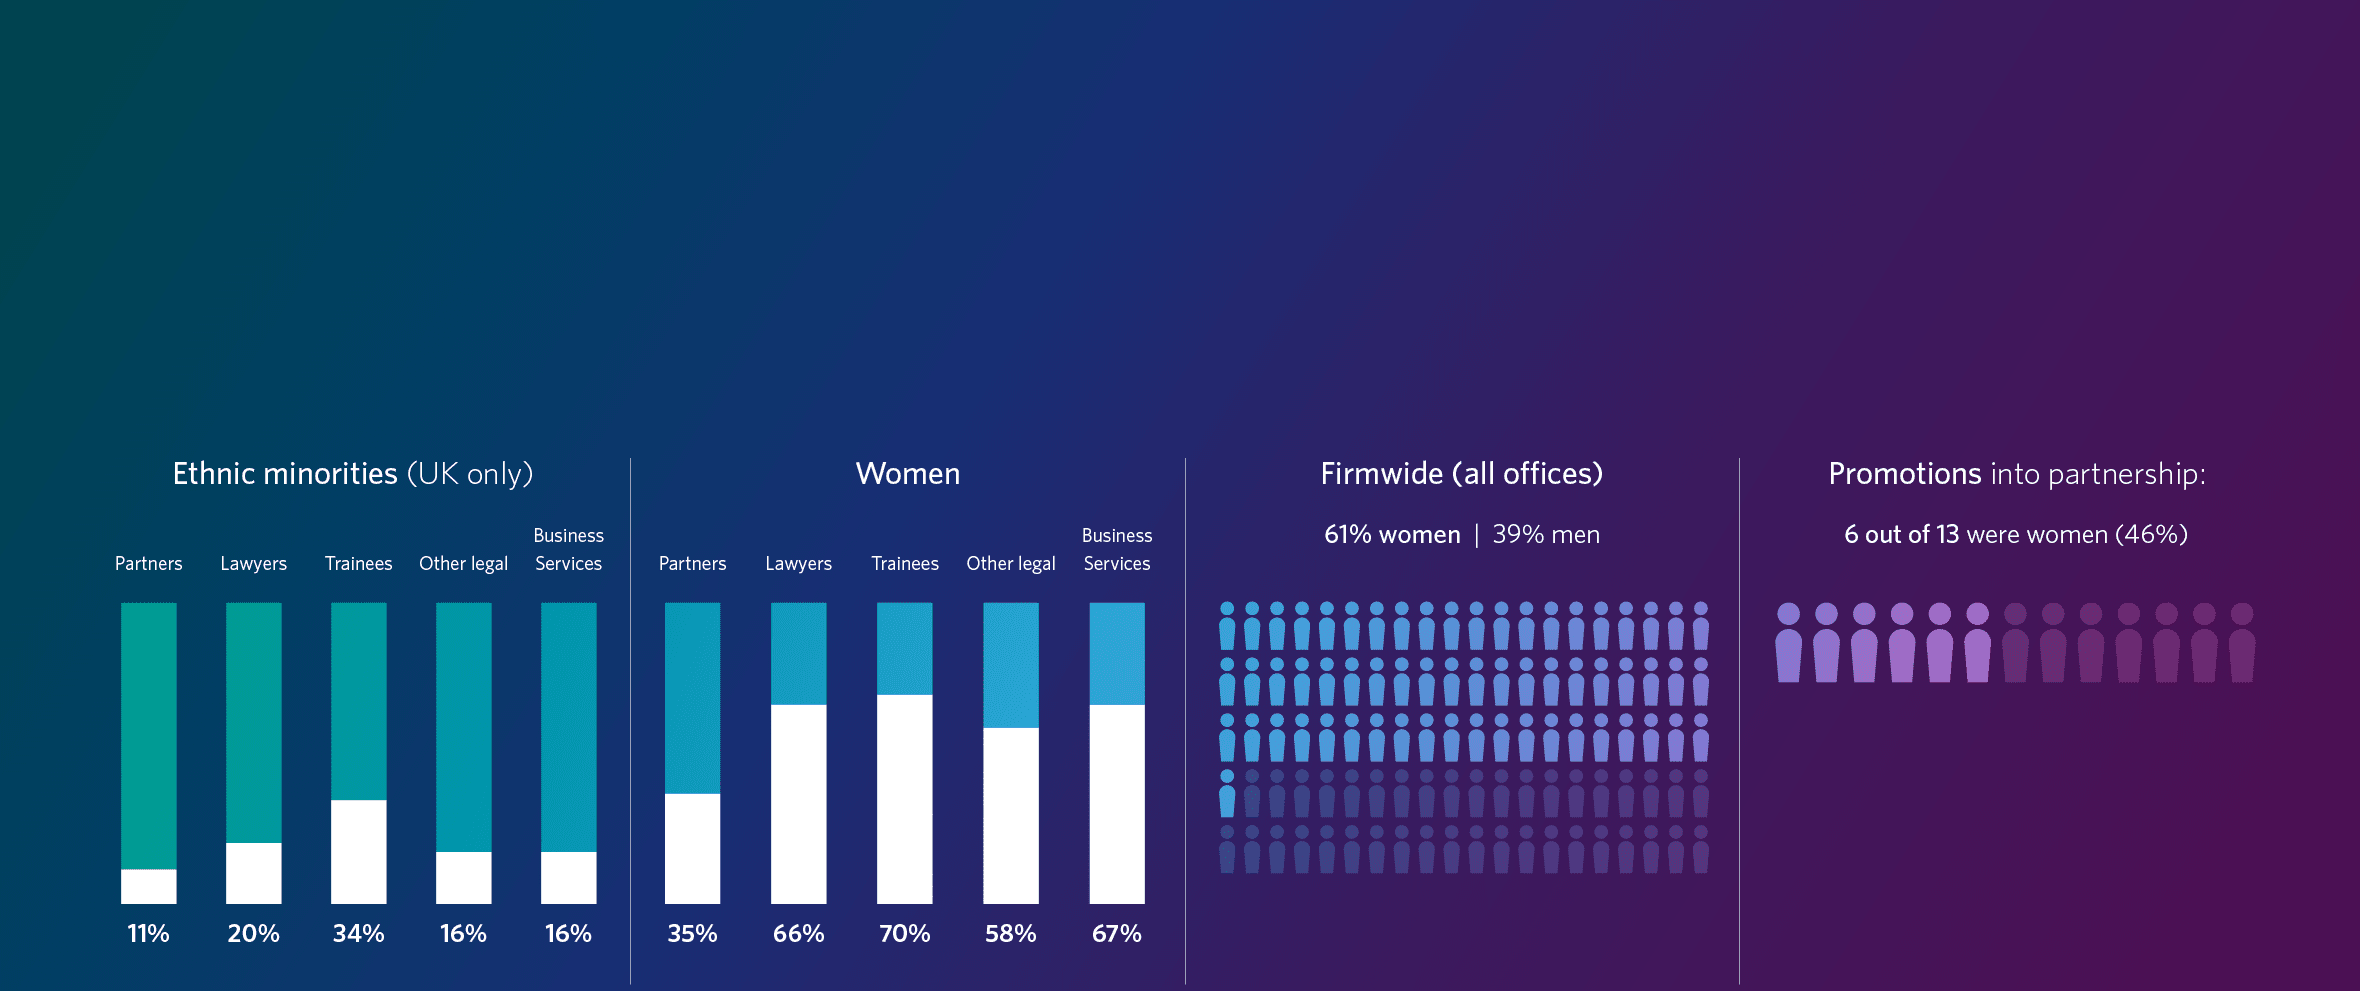
An inclusive firm with a diverse workforce
Current diversity statistics as of April 2025*


Sustainability in action 2025


12
Sustainability in action 2025

* For further context regarding the firm’s position for England and Wales, please see SRA Diversity Data Publication 2025
Our Firm progress snapshot
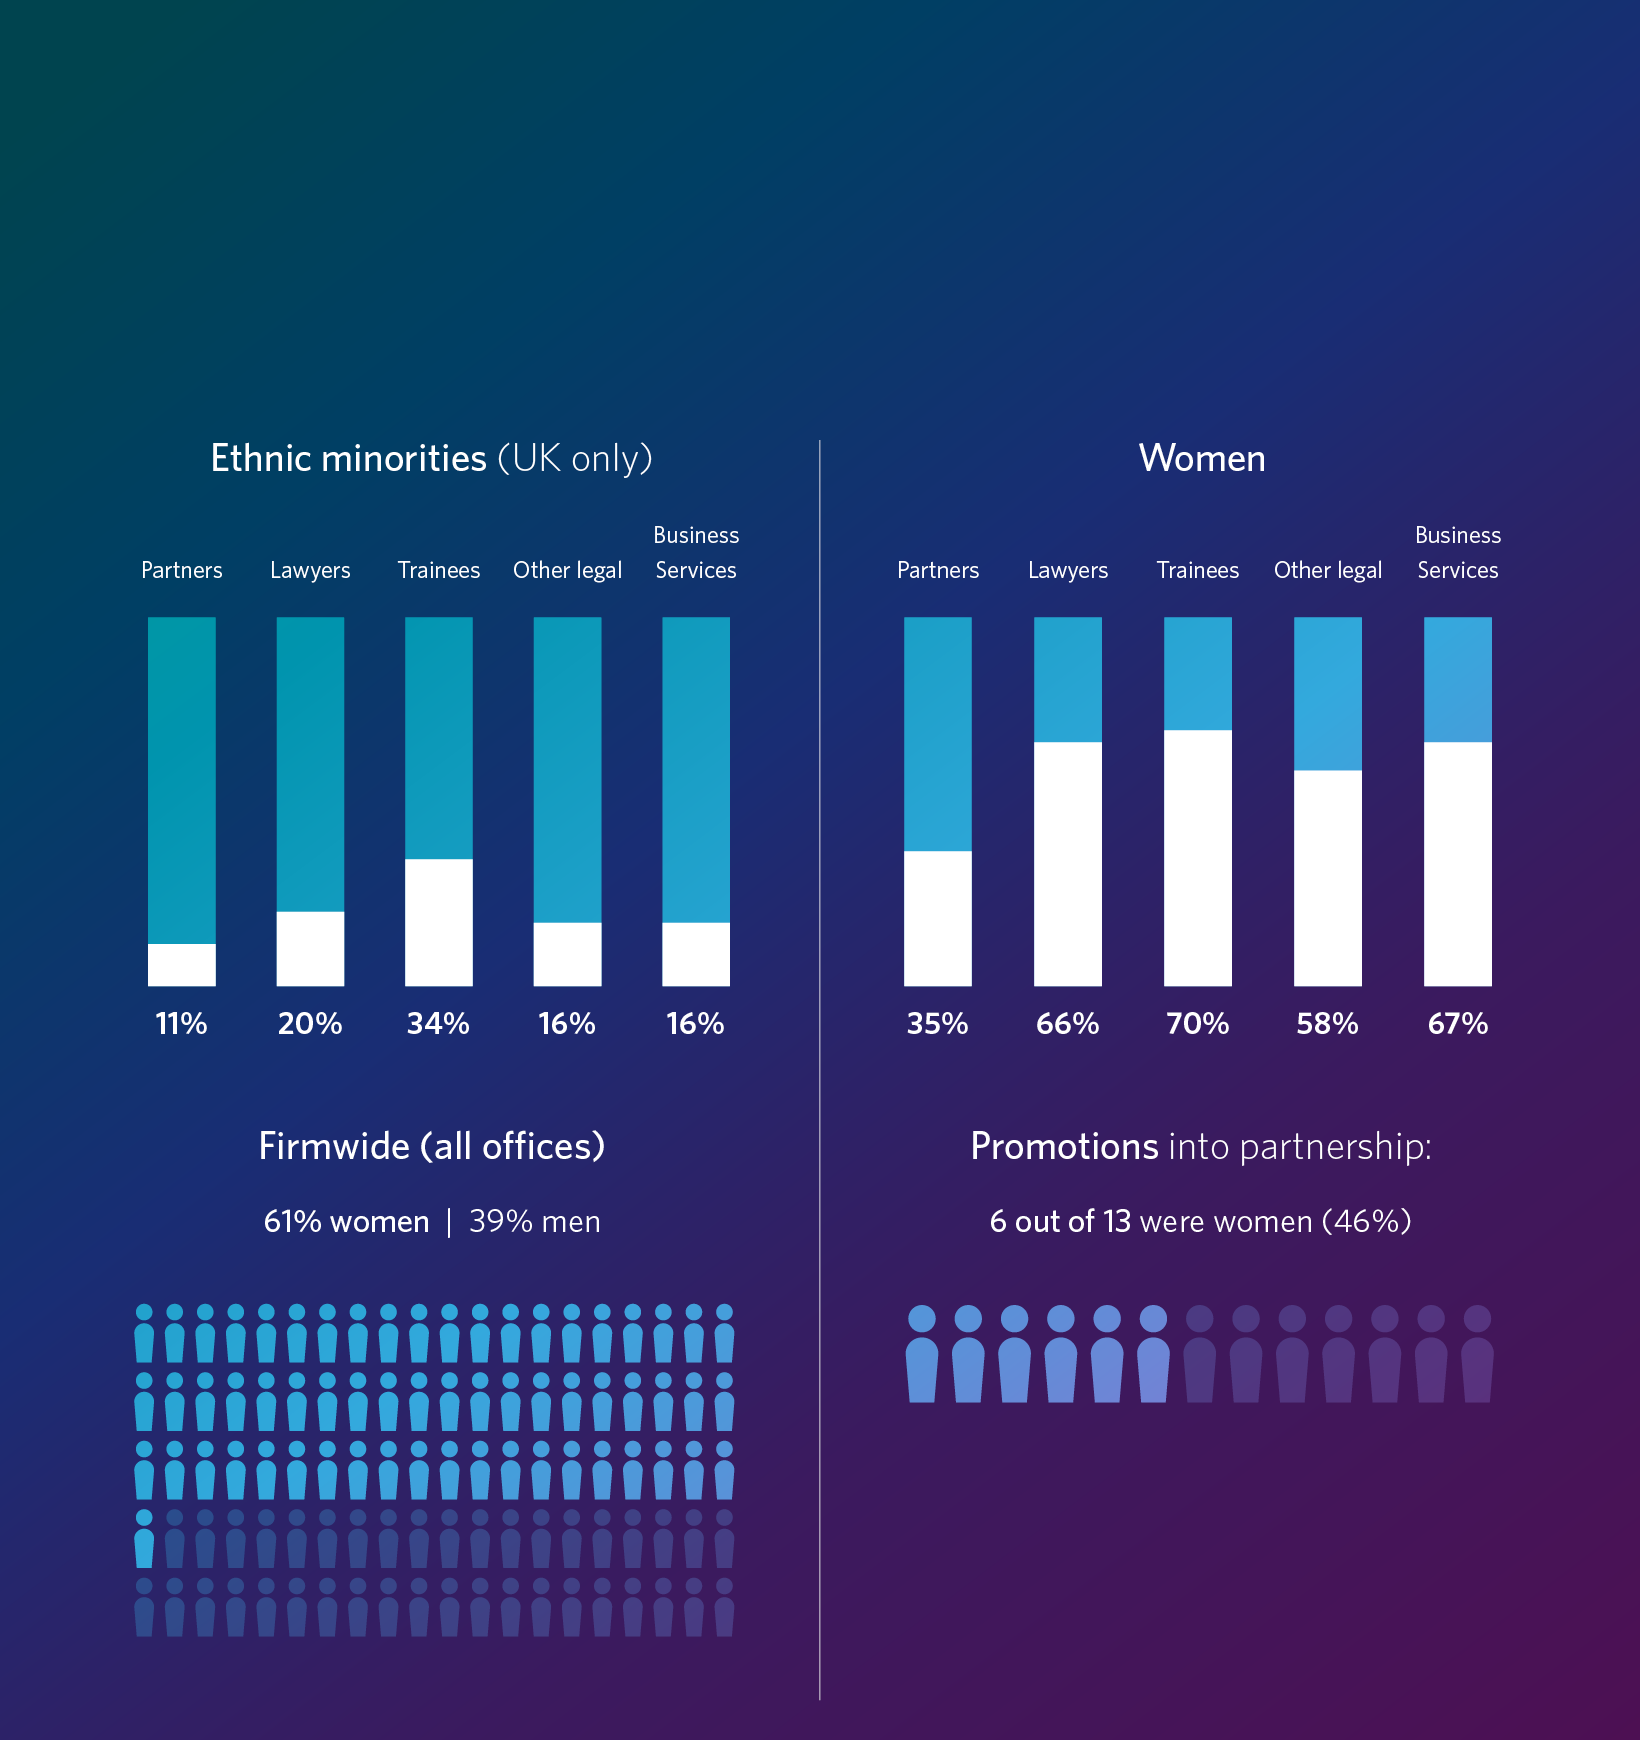
An inclusive firm with a diverse workforce
Current diversity statistics as of April 2025*


12